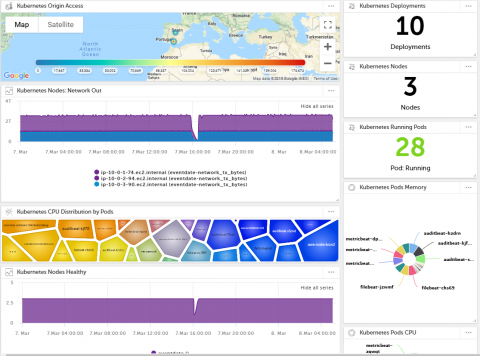
Introducing Devo Activeboards: A New Way to Visualize Machine Data
The data visualization space is crowded. There are lots of tools, each purporting to be the tool that solves your data woes and leads you to insight via illustrations. But while you may get good-looking graphs, you are probably not seeing the behind-the-scenes pain from IT: analytics dashboards and vertical applications take multiple meetings for gathering requirements, and they discover the direction wasn’t quite right the first time around.


