
Proven Server Monitoring Strategies for High-Growth Infrastructure

Businesses spend billions each year on troubleshooting and incident response—resources that could support more advanced solutions. This is why monitoring strategies matter for modern infrastructure teams. Many organizations juggle up to 30 monitoring tools, yet those with a strong approach see impressive returns, with 41% gaining over $1 million in yearly value.
Our experience with high-growth systems shows that server performance monitoring demands both the right tools and methodologies. Server monitoring tools must deliver up-to-the-minute insights and work smoothly across hybrid environments. Without complete performance visibility, teams risk missing critical events that trigger downtime or data loss.
This guide explains proven monitoring strategies and helps you choose effective server monitoring software to shift from reactive troubleshooting to proactive management.
Key Metrics to Monitor for Server Performance
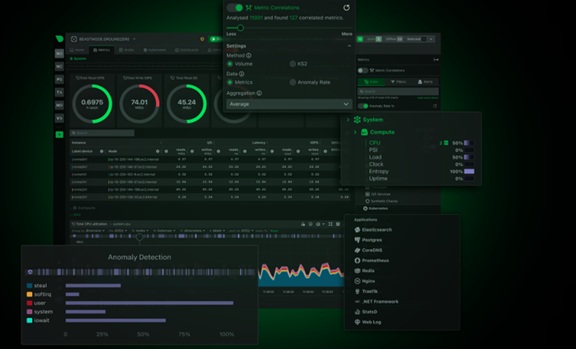
Image Source: Netdata
Server performance monitoring starts by tracking the right metrics. These indicators help identify bottlenecks before they affect users and give optimal resource allocation.
CPU and Memory Usage Patterns
CPU utilization shows how much time your processor spends on non-idle tasks. Slow response times and increased latency often result from high CPU usage. Your server's CPU usage needs monitoring for sudden spikes since these usually signal unusual events that need immediate attention.
Memory usage shows how applications and processes consume RAM. A server approaching its memory capacity signals potential trouble ahead. Baseline memory usage and peak memory usage help detect memory leaks and resource-heavy applications. Your system might need optimization if memory usage stays above 85%.
Disk I/O Throughput and Latency
Disk I/O metrics give you a full picture of storage subsystem performance through read/write speeds and operations per second (IOPS). The difference between RAM latency (83 nanoseconds) and disk latency (approximately 13ms) makes disk performance tracking vital.
Database-heavy applications can see system-wide issues from disk I/O bottlenecks. Both throughput (MB/s) and IOPS need tracking to understand disk performance completely.
Network Traffic and Connection Limits
Network monitoring reveals bandwidth utilization, packet loss, and connection counts. These metrics show how well your server talks to clients and other services. Connection limits need careful watching—servers at maximum concurrent connections will queue new requests, which might cause timeout errors.
Application-Level Metrics: Error Rate, Latency, RPS
Error rate tells you what percentage of requests fail or get no response. This vital indicator helps spot application problems and should trigger alerts quickly. Response time, both average (ART) and peak (PRT), determines how good the user experience is.
Requests per second (RPS) shows how many requests your server handles in a specific timeframe, helping you know if it can manage traffic spikes smoothly.
Security Metrics: Unauthorized Access and Log Patterns
Failed login attempt monitoring helps detect potential brute-force attacks. Unauthorized access attempt tracking spots security breaches early before they cause widespread damage. Regular security checks through penetration testing find vulnerabilities that attackers might use.
Proven Server Monitoring Strategies for Scaling Infrastructure
Your infrastructure just needs thoughtful monitoring strategies that grow with your systems. Smart organizations use these five proven ways to keep track of everything while handling the complexity, rather than just reacting to problems.
1. Configure Metrics Based on SLA and User Geography
Your operational targets become clear when you set monitoring thresholds based on service level agreements (SLAs). Critical apps that need 99.99% uptime should have stricter alert thresholds than internal tools with 99.9% SLAs.
Location matters too. Testing from multiple spots shows performance differences that single-location tests miss. Teams that put monitoring agents in different places can spot regional outages before they hit more users.
2. Correlate Metrics Across Layers for Root Cause Analysis
Looking at metrics in isolation doesn't tell the whole story. The best server monitoring tools relate data from all infrastructure layers. You should check CPU, memory, and network metrics right away when app response times jump to find the bottleneck.
Teams that analyze across layers fix problems 63% faster than those who look at metrics separately.
3. Automate Monitoring Workflows and Alert Triggers
Modern infrastructure has outgrown manual monitoring. Your server monitoring software can handle common problems by restarting failed services, adding resources during traffic spikes, or rotating logs automatically. It also helps to use dynamic thresholds that change based on past patterns - this cuts down false alarms while catching real problems.
4. Build Role-Specific Dashboards for Teams
Each team member needs a different view. Developers want code-level performance metrics, ops teams focus on resource usage, and executives care about business metrics.
Teams use monitoring 47% more when they get role-specific dashboards. These custom views help everyone see what matters to them without getting lost in extra details.
5. Continuously Optimize Platform Based on Utilization
Server performance monitoring creates valuable usage data. This information helps you size resources correctly - you save money by finding underused servers and prevent slowdowns by spotting overloaded systems.
Regular analysis of which metrics give useful insights helps trim unnecessary monitoring overhead.
Tooling and Software Considerations
Modern IT environments require server monitoring tools that provide complete visibility and support the growing complexity of hybrid and cloud based systems. The right platform helps teams detect issues early, understand performance patterns, and maintain stability as infrastructure expands. Strong solutions combine analytics, integrations, and scalability, which allows organizations to manage evolving demands with confidence.
The key capabilities to look for include:
- Deep analytics and actionable dashboards. The best server monitoring tools offer detailed performance data, flexible visualization options, and immediate alerts. These capabilities let teams identify unusual activity before it disrupts operations. Platforms that support quick customization help users focus on the metrics that matter most to their responsibilities.
- Reliable performance in hybrid environments. Monitoring solutions must integrate smoothly with cloud providers such as AWS, Azure, and Google Cloud as well as on premises systems. A unified view of all assets enables teams to see how each component interacts with the rest of the infrastructure. Collector based insights reveal what happens inside complex environments and allow faster root cause identification.
- Compatibility with existing systems. Tools should work well with the technologies already in place. Seamless interoperability reduces setup time, prevents visibility gaps, and creates a more consistent monitoring experience across applications, servers, and distributed resources.
- Strong scalability for long term growth. High growth teams need monitoring platforms that can support thousands of nodes, heavy data volumes, and distributed architectures without performance degradation. Solutions that scale efficiently allow organizations to expand confidently while maintaining consistent observability.
Operationalizing Monitoring in High-Growth Teams
High-growth environments depend on strong processes that help teams interpret data, reduce alert fatigue, and act quickly when issues arise. Tools and metrics matter, but consistent operational discipline determines how effective monitoring becomes in daily practice.
Security analysts already spend a significant portion of their day reviewing minor alerts, which makes efficient workflows essential for maintaining focus and preventing burnout. Teams benefit most when they create structured systems that support collaboration, clarity, and faster decision-making.
Effective operationalization centers on several core practices:
- Building a centralized knowledge base for incidents. A single repository keeps important information accessible. Teams often lose valuable insights in emails, comments, tickets, or personal notes, which slows down troubleshooting. A unified knowledge base containing FAQs, runbooks, troubleshooting steps, and environment specific details helps team members resolve incidents faster and maintain consistent procedures.
- Analyzing historical alert patterns to reduce noise. Teams handle large volumes of alerts across cloud and on premises systems, and a significant portion of them are unnecessary. Studying alert history helps identify patterns that create false or repetitive notifications. Grouping alerts into critical, error, and warning levels helps teams prioritize work more effectively and reduces stress from constant interruptions.
- Training teams on dashboards and alert handling. Clear training ensures that each team member knows how to interpret metrics, respond to alerts, and escalate issues correctly. Network engineers follow bandwidth related notifications while application teams focus on performance indicators. Companies see much higher monitoring adoption when dashboards are designed for specific roles. Training should also include best practices for escalation paths and the use of incident management tools.
Conclusion
Server monitoring is essential for teams aiming to improve performance and prevent costly downtime. Organizations that invest in strong monitoring strategies consistently achieve significant value. Tracking CPU, memory, disk, network, application, and security metrics gives teams the visibility needed to avoid bottlenecks and protect systems.
The strategies outlined here help growing infrastructures stay stable and efficient. Clear SLAs, correlated metrics, automated troubleshooting, role-based dashboards, and data-driven optimization create stronger and more reliable environments.
Teams should choose monitoring solutions that integrate easily across hybrid systems and scale without losing performance. With disciplined processes, better alert management, and strong training, organizations can move confidently toward proactive operations and consistent high performance.